關於 sns.heatmap(df_wine.corr(), annot=True, linewidths=.05, ax = ax )?
sns.heatmap(df_wine.corr(), annot=True, linewidths=.05, ax = ax ) 有點不太理解 (ax = ax) 詳細來說是什麼效果, 請問可以多講一些嗎 謝謝!!
回答列表
-
2021/12/26 上午 00:35王健安贊同數:0不贊同數:0留言數:1
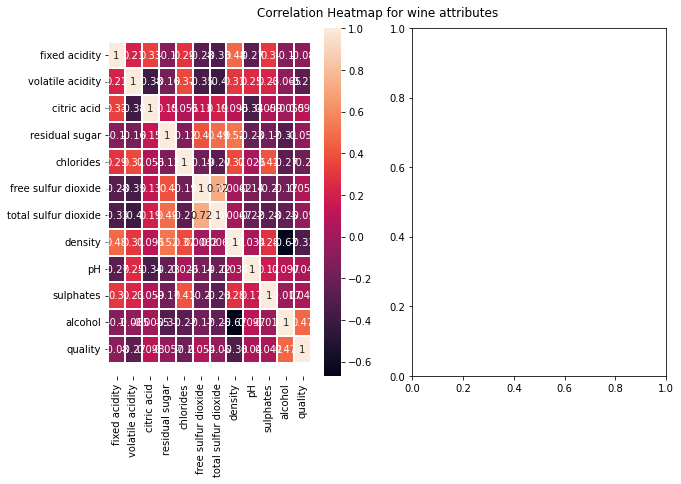
A. Hung 您好, (ax = ax) 的效果是當我們想要製作出一個子圖時, 畫出來的 heatmap 要放在哪個子圖內, 在範例程式中, f, ax = plt.subplots(figsize=(10, 6)) 就是製作子圖架構, 其中的 f 指的是整張圖,ax 指的是每張子圖的集合, 只是由於沒有指定要切成多少張子圖,因此預設會是一張圖, ax 就只會有一個「子圖」的結果, 因此就可以直接放 heatmap 中當作參數, 以下我有寫了若是呈現出有子圖的狀況, 程式會長這樣,以及呈現出來的結果: ```python # 熱力圖 f, ax = plt.subplots(nrows=1, ncols=2, figsize=(10, 6)) b = sns.heatmap(df_wine.corr(), annot=True, linewidths=.05, ax=ax[0]) f.subplots_adjust(top=0.93) bottom, top = ax[0].get_ylim() ax[0].set_ylim(bottom + 0.5, top - 0.5) title= f.suptitle('Correlation Heatmap for wine attributes', fontsize=12) ```