1. 想並排顯示 但出錯了 求解 2. 這些圖可以OUTPUT 成 JPG / PRINT IN EXCEL FILE ?? 如可以, 如何做?
2021/02/18 上午 11:24
使用 Seaborn 進行資料視覺化 (4/27更新)
Nat
觀看數:18
回答數:1
收藏數:0
np.random.seed(0) x = np.random.randint(500, size=1024) plt.subplot(2,1, 1) #此行加入subplot sns.distplot(x, bins=20, rug=True, kde=True, ax=ax[0] ) ### plt.subplot(2, 1, 2) sns.distplot(x, bins=100, kde=False, ax = ax[1]) ### plt.show() 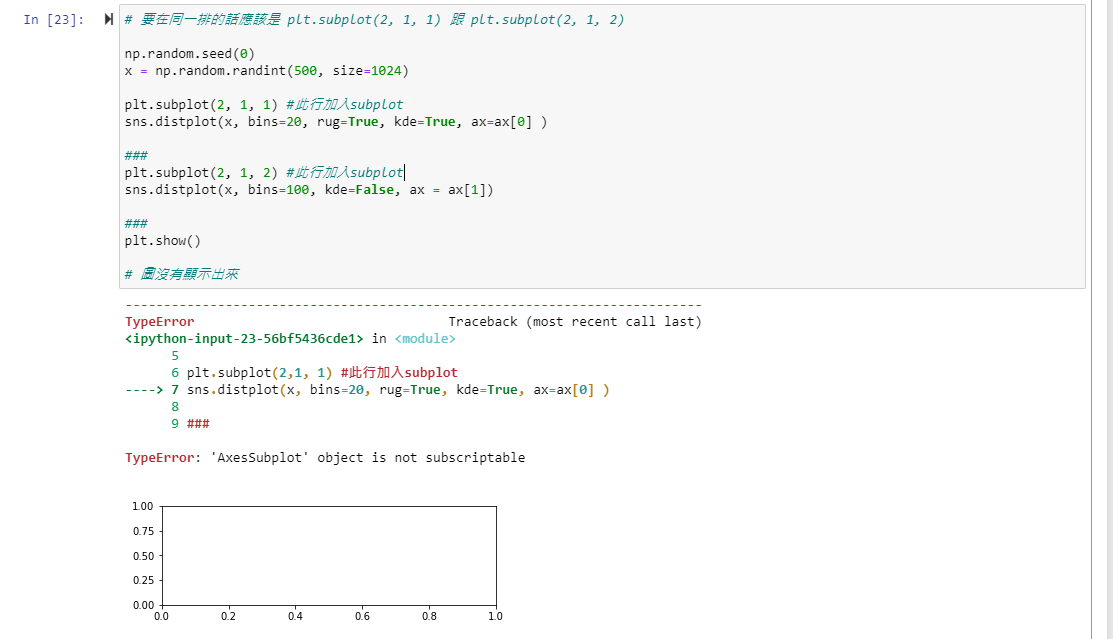
回答列表
-
2021/02/18 下午 05:35張維元 (WeiYuan)贊同數:0不贊同數:0留言數:0
嗨,你好
有可能是 x 的問題,或是套件版本的問題?建議先更新一下
嗨,你好,我是維元,持續在不同的平台發表對 #資料科學、 #網頁開發 或 #軟體職涯 相關的文章。如果對於內文有疑問都歡迎與我們進一步的交流,都可以追蹤我的 Facebook 或 技術部落格 ,也會不定時的舉辦分享活動,一起來玩玩吧 ヽ(●´∀`●)ノ 以下分享一些我近期發表跟資料科學有關的文章,歡迎大家持續追蹤: ■ 資料分析工具那麼多,該怎麼選? 🛠️
■ 真.資料團隊與分工
■ 觀察資料的 N 件事 🔖
■ 資料前處理必須要做的事 - 資料清理與型態調整